Finance that doesn’t end at the chart.
fAInance is an AI-assisted Financial Life Optimizer. It helps you understand where your money goes, find realistic ways to improve, take a concrete action and check whether it worked.
Spend smarter. Save more. Build wealth.
Every tool sees only a piece of your finances.
The data that would support better decisions already exists. It is scattered across products that don’t talk to each other, so the user has to turn it into action alone.
Banks and budgeting apps
They know where the money went.
Receipt apps
They know what was bought.
Promotion platforms
They know what is cheaper right now.
Financial education
They explain finance in general.
Transaction → Category → Chart
It helps you understand the past. It doesn’t say what to improve next, or whether the improvement worked.
Activity Purchase detail Pattern Opportunity Recommendation Action Measurement Goal
The bank sees the amount spent at a supermarket. Only the receipt shows products, prices and promotions. The opportunity lies in joining these levels.
One system that closes the loop: from data to a measured result.
Not a bundle of features. Each stage feeds the next, and the loop repeats with new data. Choose a stage to see what happens in the app.
Financial Activity
Read-only bank transactions, manual entries and receipts flow into one shared financial model.
- Read-only Open Banking, no payments or transfers
- Declared profile kept separate from observed behaviour
- Design assumption: the app should be useful even when the user enters nothing
AI is deliberately not the source of financial truth.
Amounts, opportunities and impact measurement come from deterministic analysis. The language model interprets, prioritises and explains, but doesn’t take over the calculations.
- DataFinancial and purchase data
- DeterministicAnalysis and calculations
- DeterministicStructured opportunity
- AIInterpretation and explanation
- UserRecommendation and decision
What fAInance looks like in practice.
The screens come from the interactive MVP prototype, which is the current visual reference for the app. Data on the screens is for demonstration.
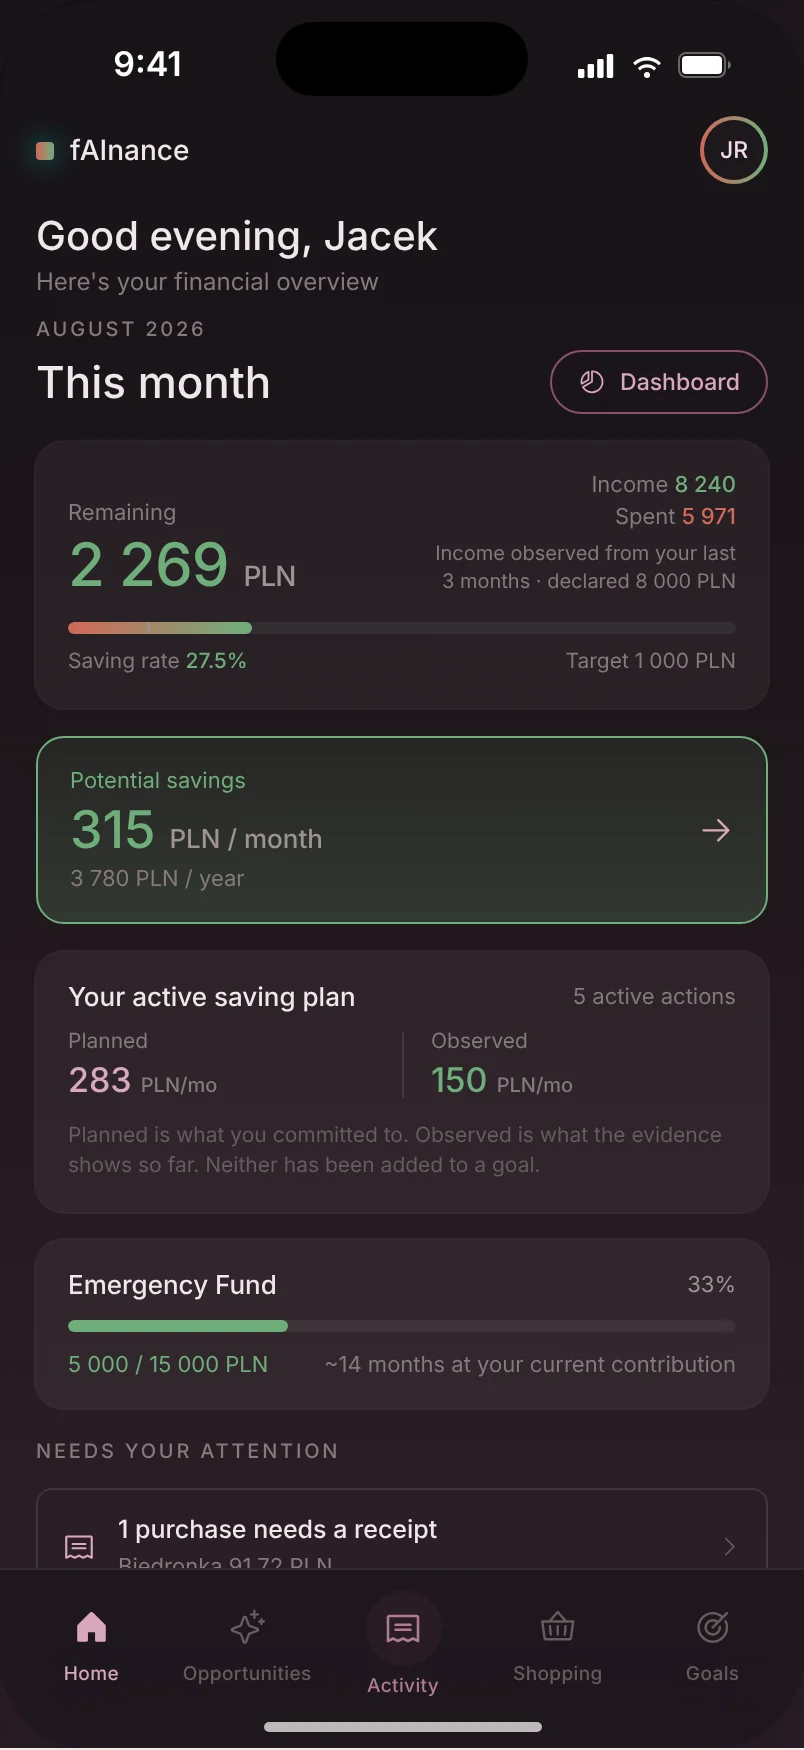
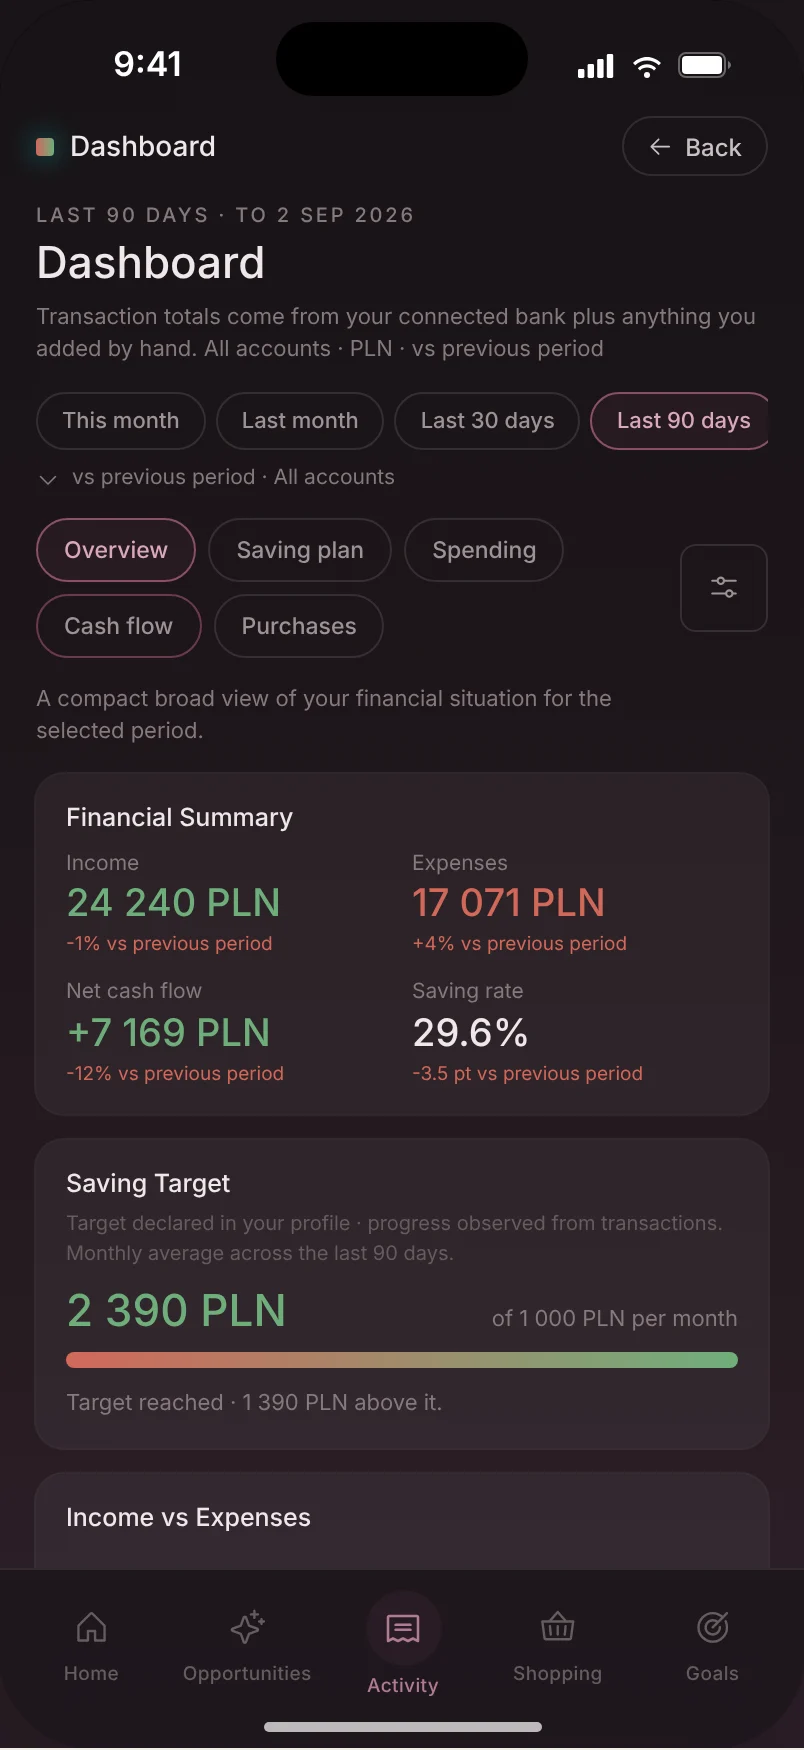
First: what is happening and what needs attention.
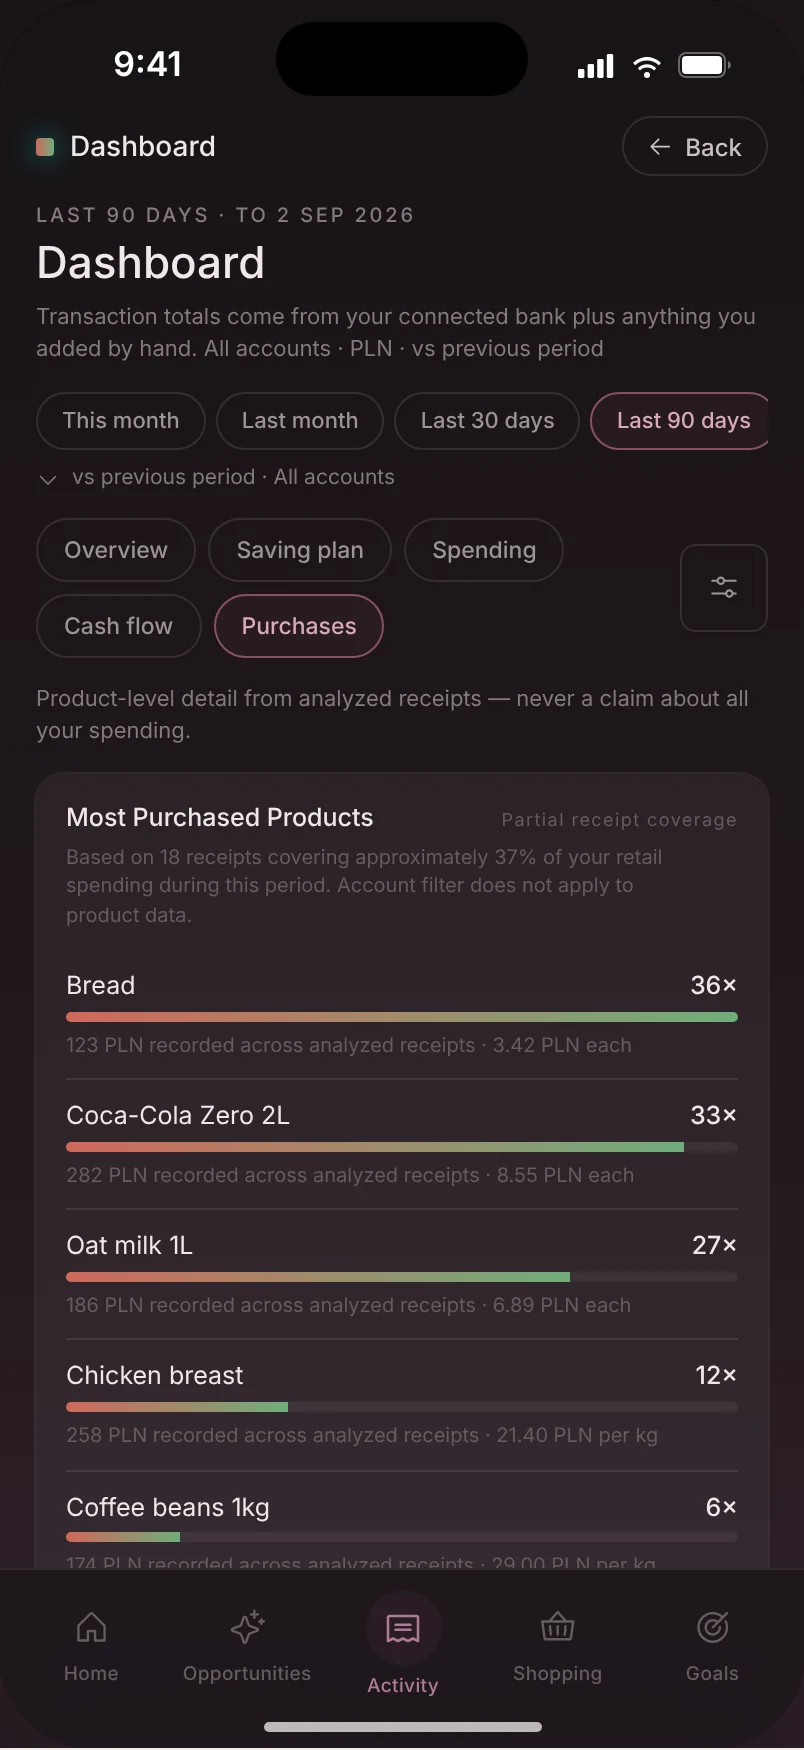
The home screen answers three questions: how do my finances look, what is changing, and what should I do next. Deeper analysis lives separately in the Dashboard, with Overview, Spending, Cash Flow, Purchases and Recurring Costs views.
Observed and declared income are shown side by side. Neither overwrites the other.
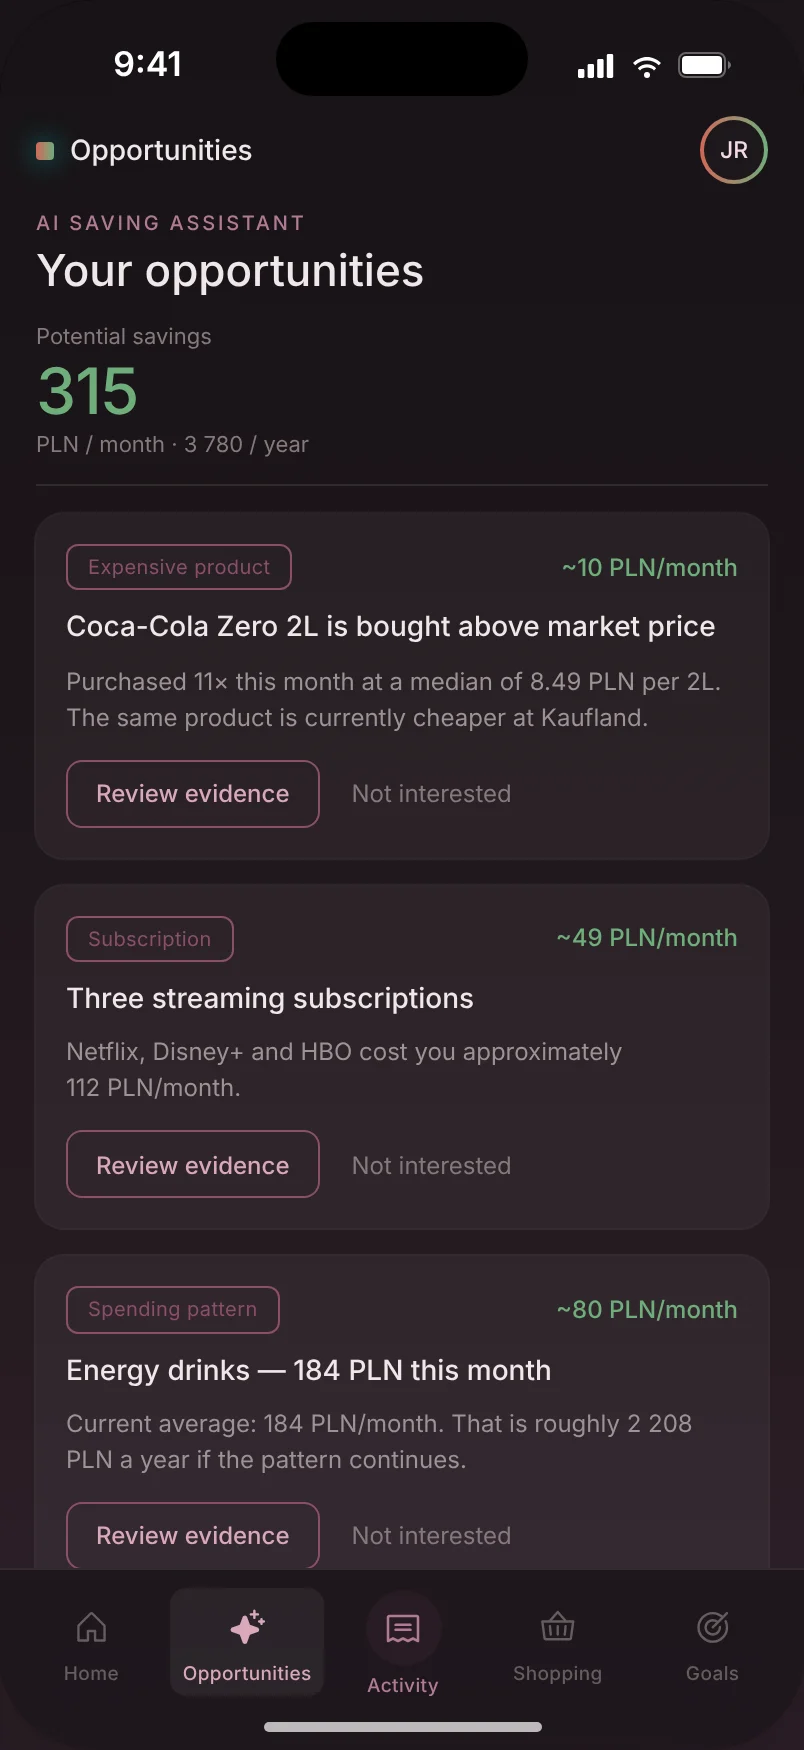
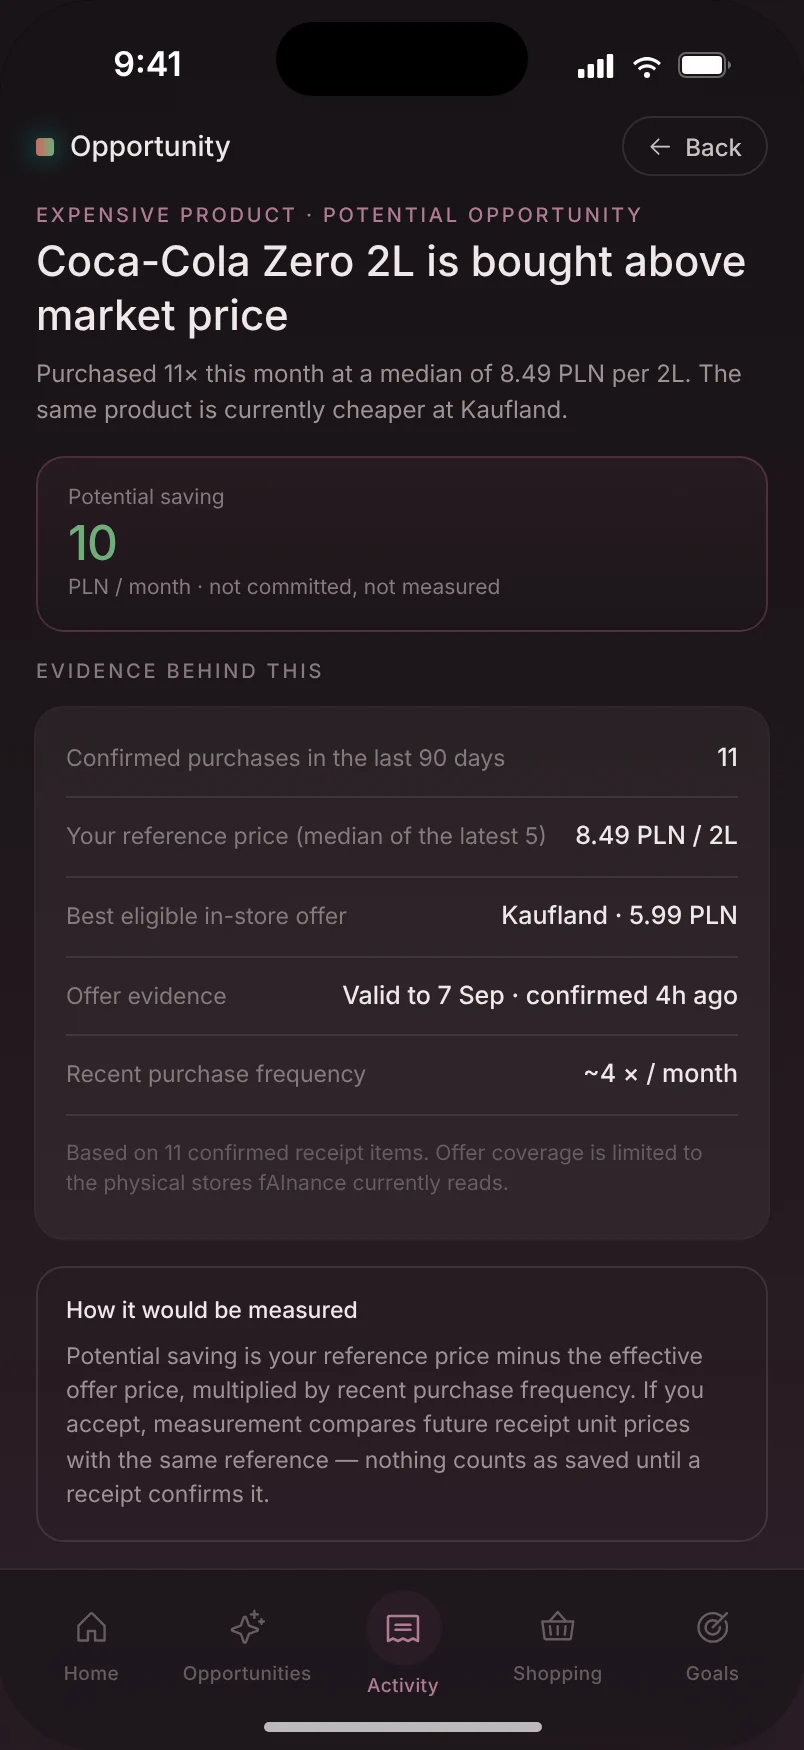
A recommendation that shows its evidence.
Every opportunity has a type, an estimated monthly and annual impact, the source of the numbers, and a description of how the effect will be measured if the user accepts it. Nothing becomes a commitment without their decision.
The status is named plainly: the screen reads “Potential saving, not committed, not measured”. Potential doesn’t pose as a result.
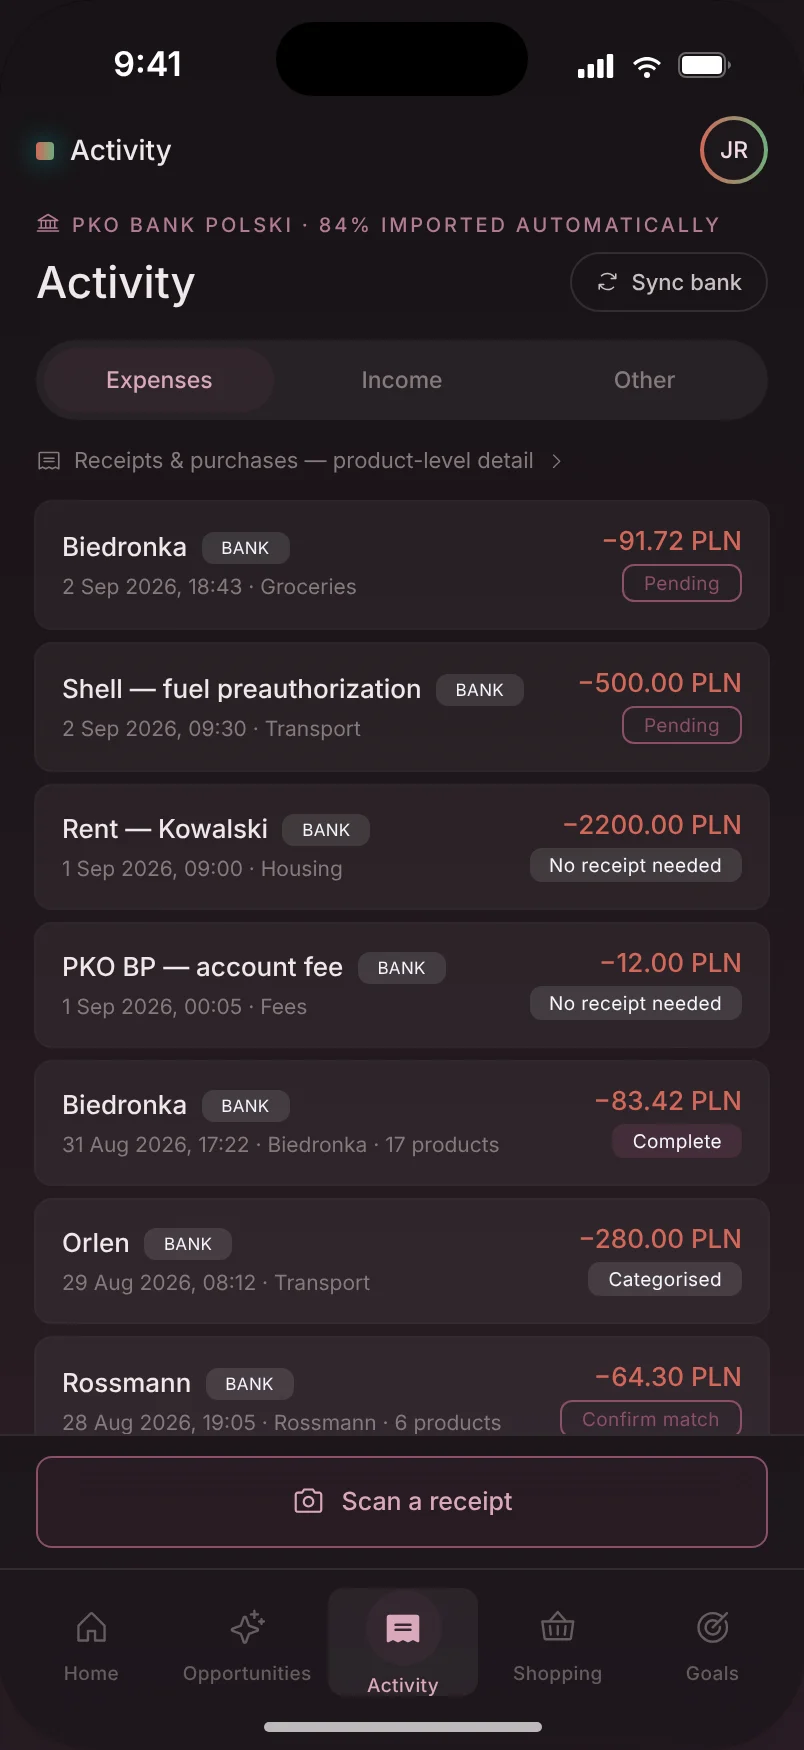
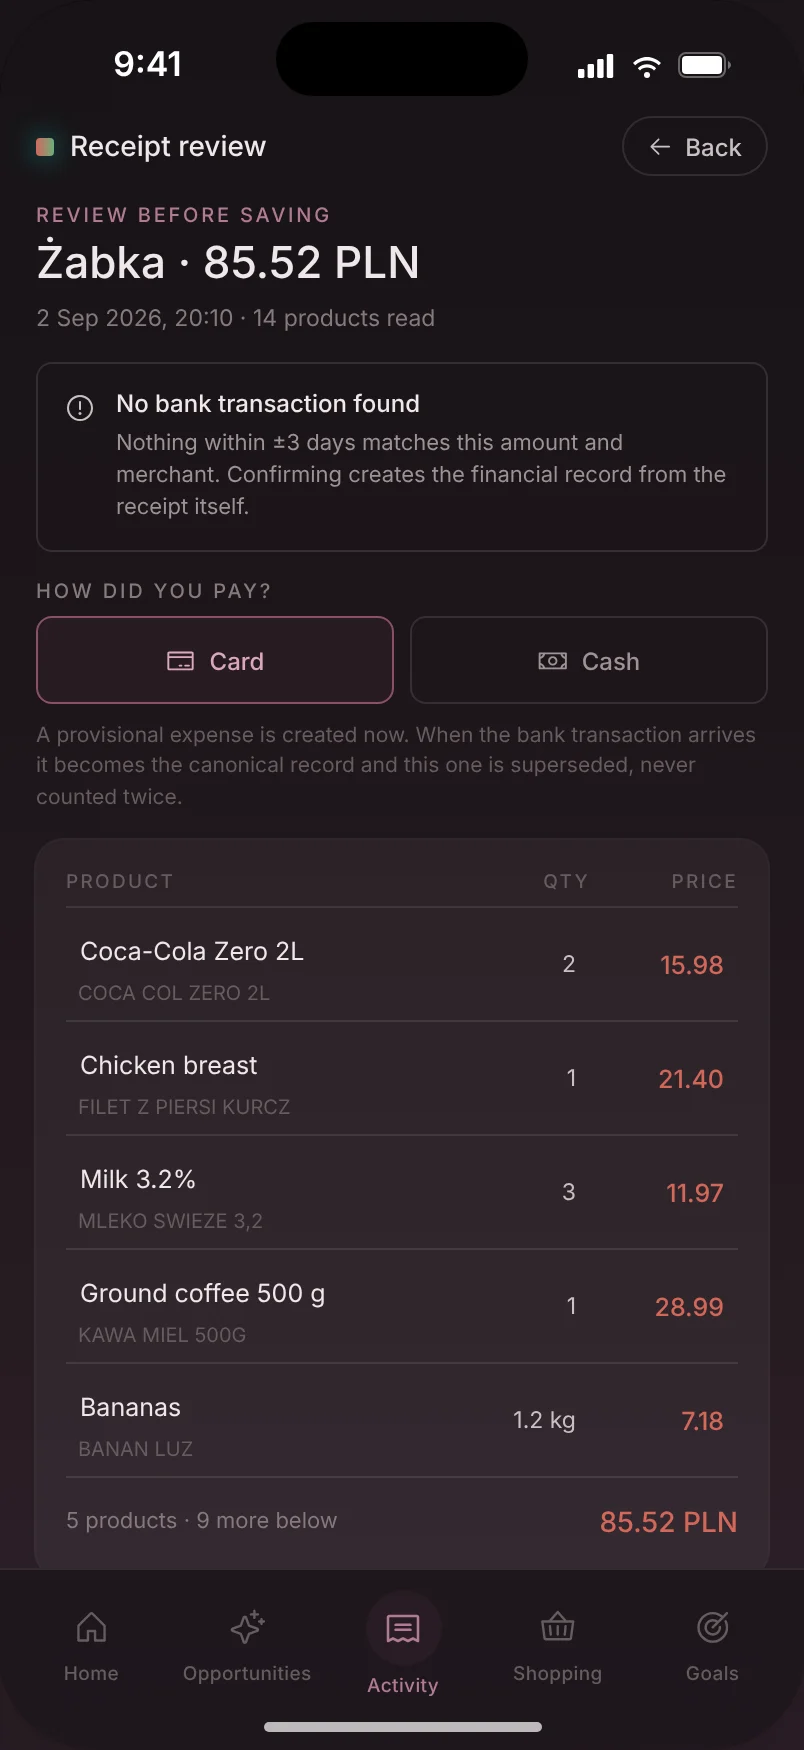
A receipt turns an amount into a list of products.
The bank sees an amount and a merchant. The receipt adds products, quantities, prices and discounts. fAInance merges both sources into one record, so a purchase is counted once, and product analytics shows what share of spending it actually covers.
A transaction is a movement of money. A receipt is proof of purchase at product level. Scanning and OCR run locally on the device, and uncertain matches need the user’s confirmation.
In-store shopping, compared fairly.
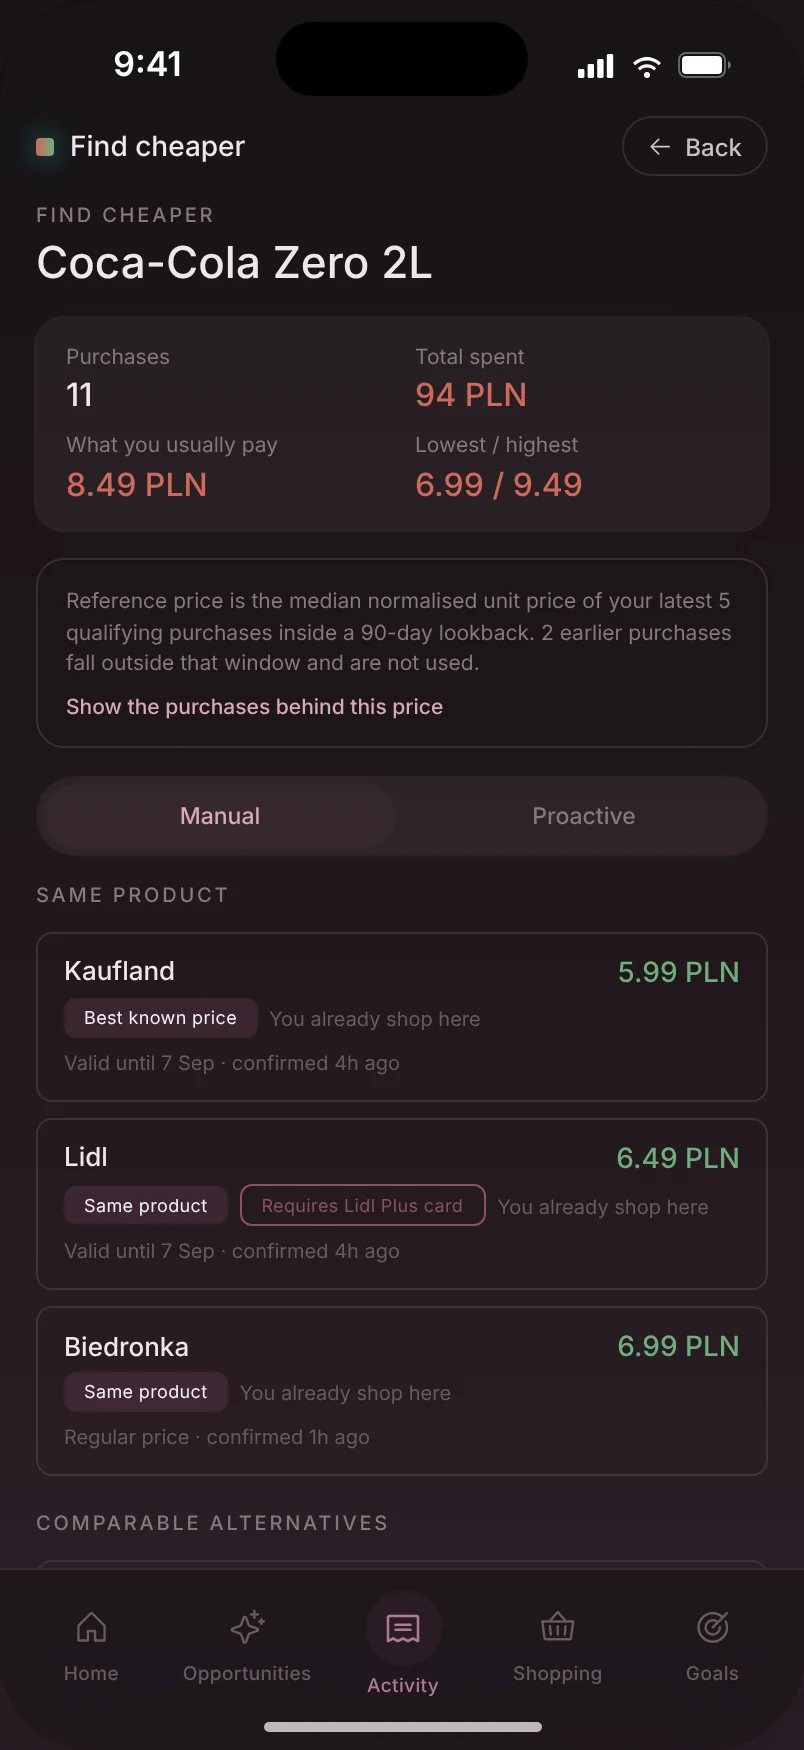
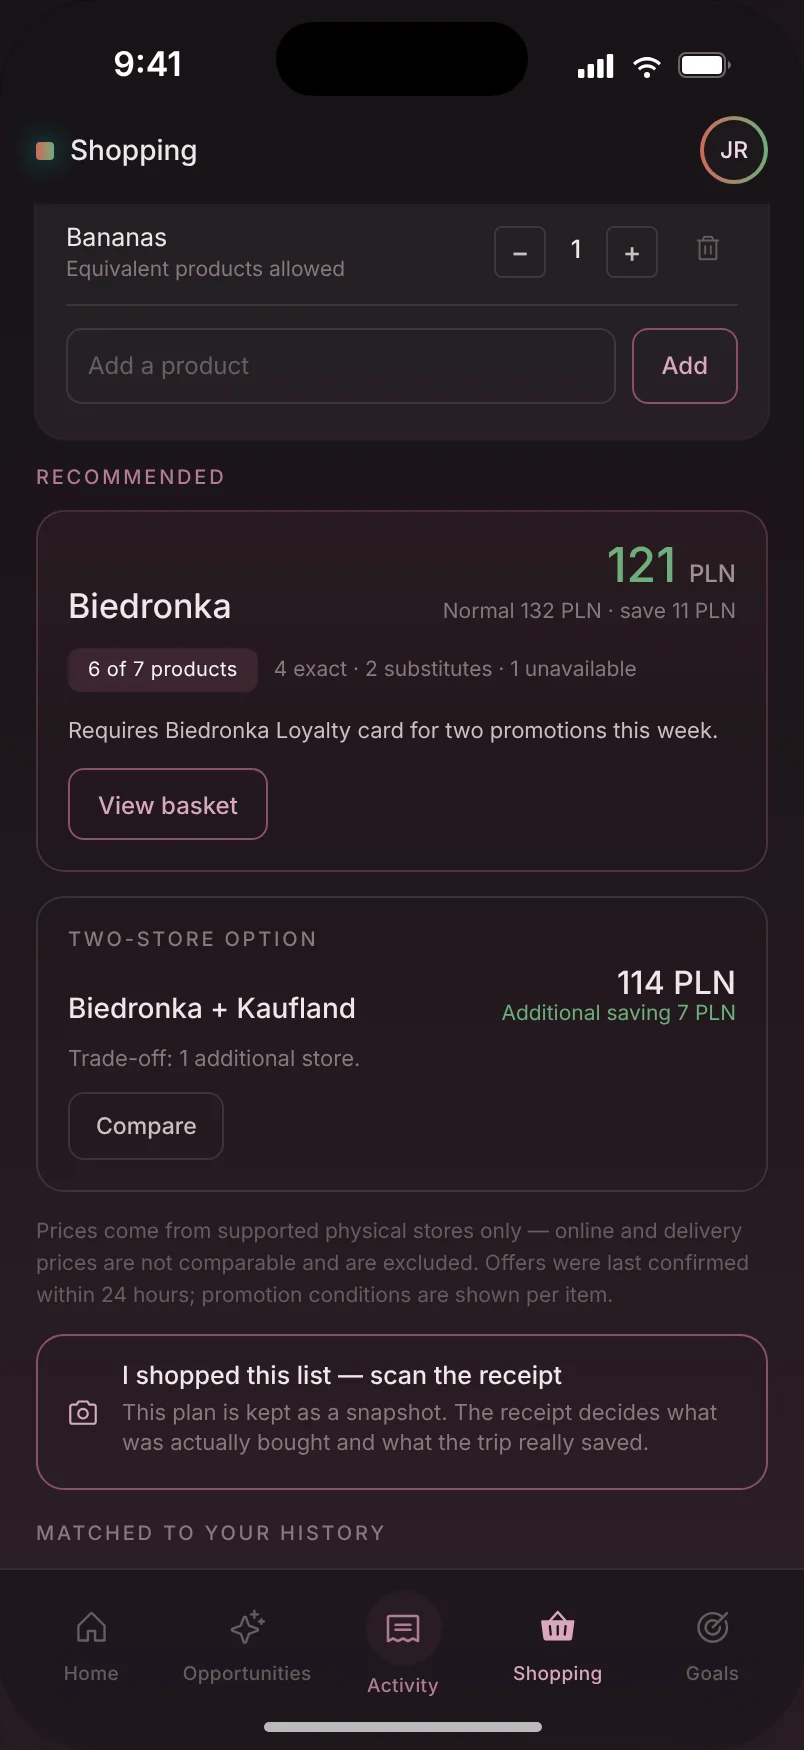
Find Cheaper compares the price you usually pay with current offers in physical stores. The list optimiser recommends one practical store, and a second only when the extra saving justifies the extra effort.
- The same product is always kept apart from comparable substitutes.
- Promotion conditions, such as a loyalty card, are shown plainly.
- The message reads “best price known to fAInance”, never “cheapest in Poland”.
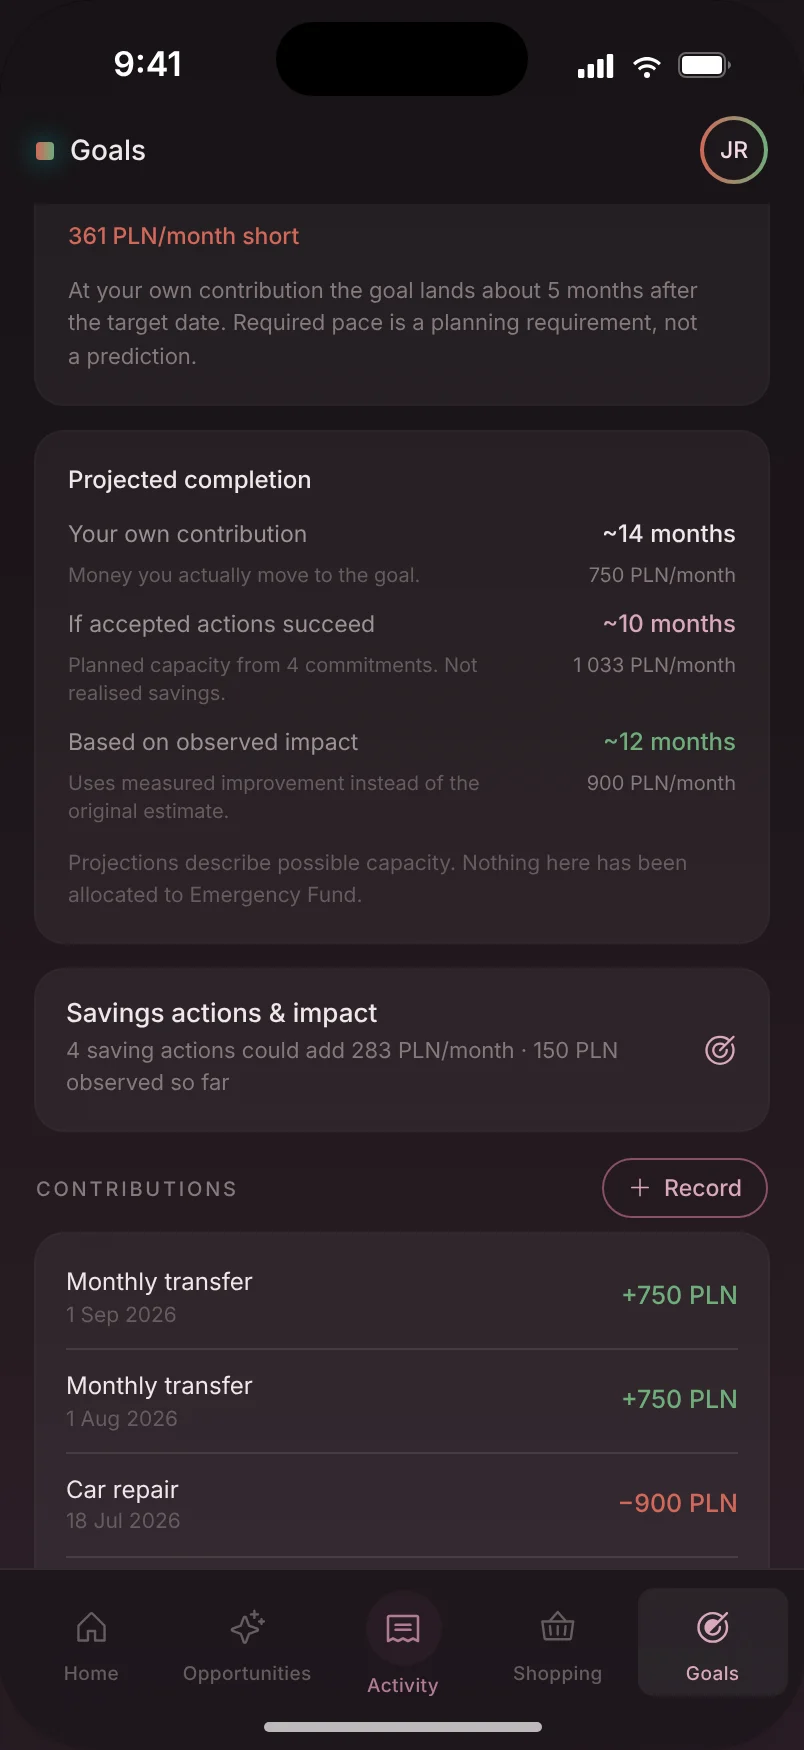
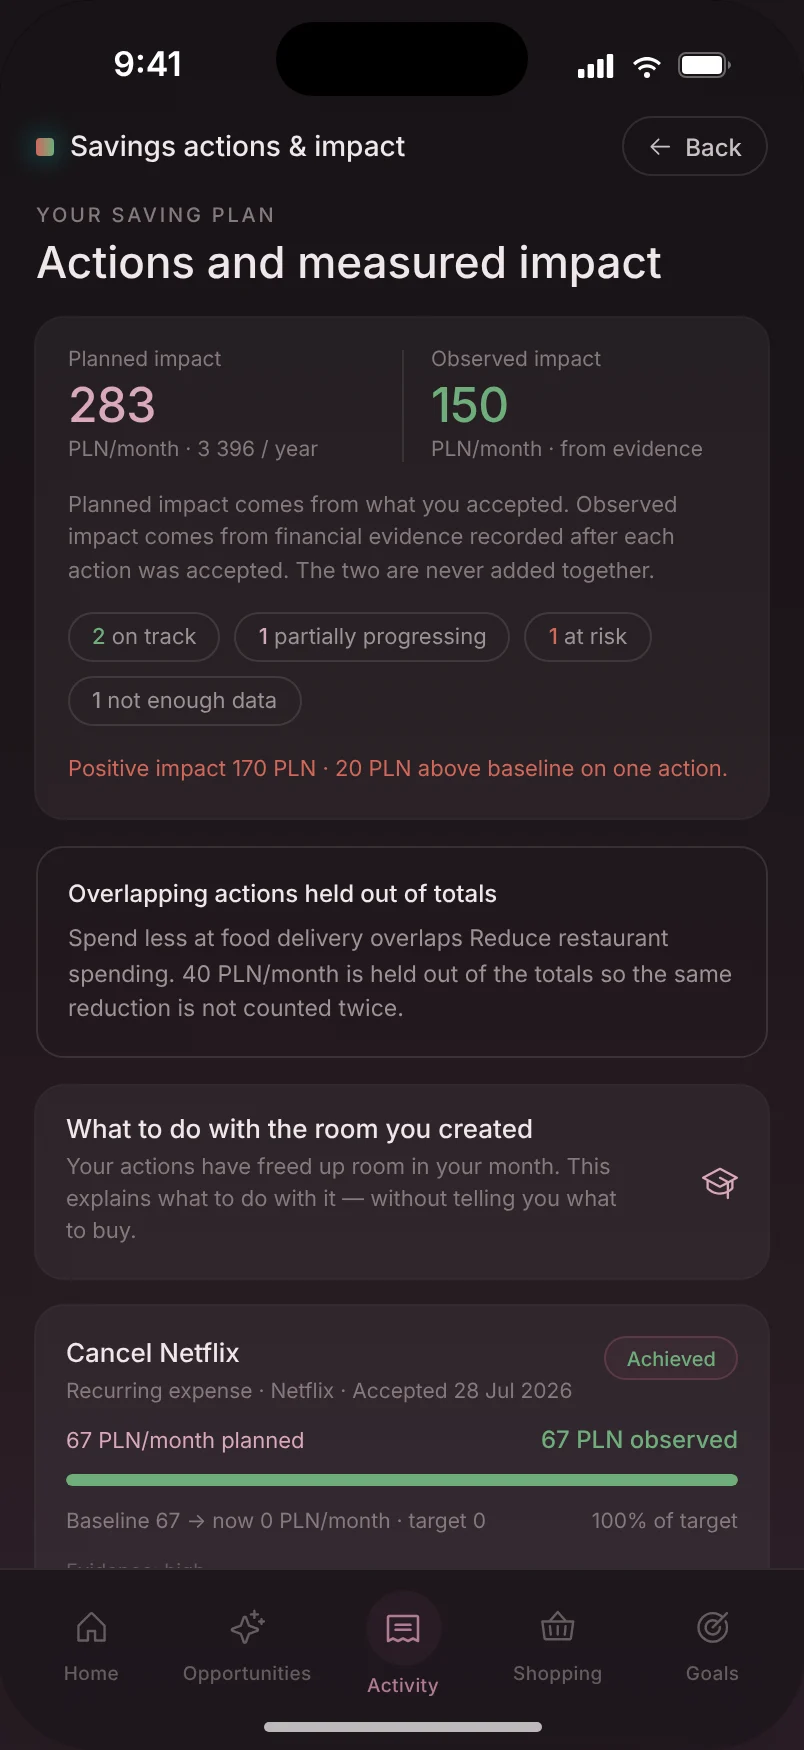
Four numbers we never merge into one.
Many apps show a single “you saved X”. fAInance separates potential, commitment, measured effect and real money on a goal. That is the foundation of trust in the product.
Potential: an opportunity found by the Saving Assistant before the user accepts anything. Neither a commitment nor a result.
Financial knowledge shouldn’t be a luxury.
We want to help people in Poland move from tracking everyday spending to deliberate saving, investing and building financial security.
From the first złoty saved to deliberately planning a financial future.
Financial literacy in Poland still has room to grow.
The share of people with a high level of financial literacy in Poland is below the EU average and clearly below the countries leading this ranking.
The indicator is not a self-assessment. It gives equal weight to a knowledge test and reported financial behaviour.
How the indicator is calculated
Knowledge is tested with five questions, including inflation, compound interest and diversification. Behaviour is based on three statements: checking affordability before buying, tracking expenses and setting long-term financial goals. The combined score runs from 0 to 10; a high level means 9 or 10 points.
Flash Eurobarometer 525, Monitoring the level of financial literacy in the EU, European Commission, fieldwork: March–April 2023, published: July 2023. View the report
- Netherlands28%
- Sweden27%
- Denmark27%
- Slovenia27%
- Germany23%
- EU average18%
- Poland15%
Cash, bank accounts and deposits
- Poland≈51%
- EU average≈30%
Listed shares, bonds, investment funds and pension entitlements
- Poland≈18%
- EU average≈31%
How do Poles hold and grow their savings?
In Poland, about half of the value of household financial assets sits in cash, accounts and deposits. Across the EU it is roughly one euro in three. Capital market instruments and pension entitlements make up a clearly smaller share in Poland.
These are shares of asset value, not the share of people who have an account or investments. Deposits are an important and safe part of personal finance. The gap also reflects wealth levels, risk aversion, history and market structure. The point is not that everyone should invest, but that people should understand the alternatives and choose deliberately.
Where these numbers come from
fAInance calculations based on Eurostat financial accounts (dataset nasa_10_f_bs, households and NPISH sector, assets, 2024). Deposits: category F2. Capital market instruments: listed shares (F511), debt securities (F3), investment fund shares (F52) and pension entitlements (F63–F65). Unlisted shares and other business equity are not included.
Eurostat, Households: statistics on financial assets and liabilities and dataset nasa_10_f_bs, 2024 data. Context: European Commission, 2025 Country Report Poland.
Knowledge isn’t only about access to information. It’s about motivation and using it in everyday life.
Warsaw Banking Institute (WIB) and GPW Foundation, Economic knowledge of Poles 2026, Ariadna panel, CAWI, N=1,099, February 2026, published 7 April 2026 (in Polish). View the study
of respondents take no active steps to deepen their economic knowledge.
report feeling financially secure, 19 percentage points more than a year earlier.
A sense of security is growing, but more than half of people aren’t looking for new knowledge. So knowledge has to reach people in an accessible form, at the moment it’s needed, and tied to their own money. This is a different study with a different methodology from the Eurobarometer, so we don’t put these numbers on the same chart.
We don’t just want to help people save. We want to help them understand what they can do with the money they’ve managed to save.
Spending analysis, finding saving opportunities, shopping optimisation and building financial goals on real data.
Accessible, AI-supported financial education: inflation, emergency funds, bonds, ETFs, diversification, risk and long-term wealth planning. These features are not available yet.
Four stages of user growth
- In MVP scope
Financial Awareness
“I understand where my money goes.”
Regaining control of spending and seeing real ways to save.
- In MVP scope
Financial Stability
“I save regularly and build security.”
Habits, an emergency fund and concrete financial goals, measured on real data.
- Next direction
Financial Literacy
“I understand investing, risk and the options available.”
Knowledge at the right moment: inflation, compound interest, bonds, risk, retirement.
- Long-term vision
Long-Term Wealth Building
“I deliberately plan and build my financial future.”
A coherent view of finances, understandable simulations and long-term planning.
Easy access to financial tools doesn’t mean the ability to make good decisions.
Many people use a banking app with ease but don’t fully understand how inflation affects savings, the difference between saving and investing, compound interest or the costs of long-term financial products. The barriers can be low income and living costs, lack of time or knowledge, or the belief that investing is only for the wealthy.
We don’t assume everyone should invest. We believe everyone should be able to understand the options and choose deliberately.
Action first, then knowledge.
Traditional financial education starts with theory and leaves the user to apply it to their own life. fAInance reverses this: it starts with everyday spending, income and shopping, helps find concrete ways to improve and measures their effect.
When savings appear, so do questions: how big should an emergency fund be, how does a deposit differ from a bond, how to assess risk. That is when fAInance should become a guide that offers knowledge at the right moment, rather than burying the user in information in advance.
Technology should support decisions, not make them for the user
Verifiable calculations, reliable sources and transparent recommendations, with a clear line between education and individual advice. We promote patience, regularity, diversification and understanding of risk.
- We don’t invest the user’s money automatically.
- We don’t replace regulated investment advice.
- We don’t present investing as a fast track to wealth.
We measure success by more than downloads and revenue
We want to measure the real value delivered to users:
- completed saving actions,
- improved financial security,
- consistency in reaching goals,
- growing understanding of financial topics,
- better habits sustained over the long term.
To make better financial decisions simpler, clearer and accessible to everyone.
We are starting in Poland because it is a market we know and where we can test this vision. We will consider further European markets with their local conditions, regulations and needs in mind.
For investors, business angels and grant institutions
The behaviours we need are already mainstream.
Poles use mobile banking and digital shopping at scale. fAInance doesn’t have to create a new habit, only connect existing ones. Research as of 22 September 2026, Polish market.
A broad base of people managing income, recurring costs, shopping and savings.
16.386M employed working-age people (GUS BAEL, Q1 2026) × 58.17% using online banking (Eurostat, 2025).
SAM × 69.7% of people buying online (GUS, 2025). This is a modelled overlap of groups. After the beta we will replace it with first-party data.
Active customer relationships with bank apps, +9.0% year on year. These are relationships, not unique people, because one person can use several banks.
The Polish market can sustain a sensible business without mass dominance.
B2C subscription layer assuming 230 PLN annual revenue per paying user. This is a planning assumption, not a validated ARPPU. No B2B, partnerships or expansion.
Poland is a validation market, not a limit.
The behaviours fAInance builds on are not specific to Poland. We still plan expansion country by country, without multiplying the EU population by a single subscription price.
Eurostat: 452 million EU residents (1 Jan 2026); in 2025, 69.7% of people aged 16–74 used online banking and 78% bought online.
- Validate the product and model in Poland
- Choose 2–3 comparable EU markets
- Validate Open Banking, store data and prices locally
- Country SAM and unit economics, product and price localisation
- Scale, only after evidence from the earlier steps
Competition is strong but fragmented.
Finance apps (such as Revolut, Wallet, Spendee) understand transactions. PanParagon understands receipts. Listonic, Blix and Ding understand lists and promotions. Cleo and Rocket Money show a move toward concrete actions. The white space isn’t any one of these features alone, but the combination of financial data, product-level shopping, price context, action and impact measurement in one system.
We monetise optimisation, not user data.
The core loop and data collection are meant to stay widely available. Users pay for continuous optimisation, monitoring and automation. Recommendations can’t be ranked by a partner’s fee.
Free
The full core financial loop, enough to trust the product. Data collection, including receipts and correcting your own data, stays widely available.
Premium
- Fuller Saving Assistant and proactive opportunity monitoring
- Multiple measurable Saving Actions
- Deeper financial reviews and automation
- Extended financial goals
fAInance Insights
Aggregated, properly anonymised market intelligence: prices actually paid, basket structure, reactions to promotions, category trends. For retailers, FMCG producers, pricing teams and research firms.
Where did my money go?
What is the most sensible thing I can do with my money right now?
Vision: a financial and shopping platform, not a single app
- B2C subscriptionFirst stage
- B2B market intelligencePlanned
- Selective partnerships, with no influence on rankingPlanned
- European expansionPlanned
Beyond the pitch-deck stage.
The MVP product and domain logic was frozen on 4 September 2026, and implementation continues. Below is the status per the project documentation from September 2026. The app has not been publicly released.
- Engineering foundation
- Financial Activity
- Analytics and Dashboard
- Saving Actions
- Financial Goals
- Notifications and automation
- Receipt Intelligence
- Receipt ↔ transaction reconciliation
- Product Identity
- Retail Intelligence and Shopping
- Open Banking (read-only)
- Integration, hardening and release preparation
Implementation architecture: React Native with Expo, a React web client, a FastAPI backend, PostgreSQL, AWS with SQS queues and Terraform, read-only Open Banking and on-device receipt OCR.
Five stages. Each next one only after evidence.
Moving between stages depends on retention, real payments and economics, not on the calendar. Later stages are not guaranteed.
- Now
Finish the MVP
Full MVP scope, testing, integration stabilisation, security and monitoring. Funnel instrumentation and a paid offer.
Polish beta and validation
First testers and a cohort from paid channels. Measuring activation, returns, Saving Actions and paid Premium.
Product-market fit and controlled growth
Repeatable channel tests, cohort retention and conversion, higher system load.
Scaling in Poland
Distribution, support and reliability after evidence of a repeatable model. Analysis of an own, hybrid Open Banking layer.
European expansion
Country-by-country pilot with local validation of banks, store data, regulation and acquisition cost.
What the beta must prove
Does combining transaction data with product knowledge produce improvement opportunities valuable and measurable enough that users come back and are willing to pay?
- Does the user get a first valuable insight fast enough?
- Do they return after receiving a recommendation?
- Do they accept and carry out Saving Actions?
- Does the measured value justify Premium?
Let’s talk about fAInance.
If you’re interested in fAInance as an investor, partner or grant institution, write to us. We’ll show the live prototype and walk through the validation plan.
Jacek Richert and Aleksander Michalak